State and Local Funding for Public Higher Education
- From fiscal year 1980 to 2020, the amount appropriated per full-time equivalent enrollment (FTEE) by states and their localities for public higher education peaked twice, first in the late 1980s and again in the early 2000s (Indicator IV-07a).1 At both time points, appropriations were in the vicinity of $10,000 per FTEE (adjusting for inflation). By 2011, however, these appropriations had dipped below $8,000 for the first time since data became available, and by 2012 they had reached a nadir of $7,039. Over the subsequent eight years, appropriations increased steadily. By 2020 they were $8,636 per FTEE, an increase of 23% from the 2012 low and 85% of the 2000 high.
- The range in amounts appropriated in 2020 by states (including the District of Columbia) and their localities per FTEE for public higher education was considerable (Indicator IV-07b). With per FTEE appropriations of almost $21,802 for fiscal year 2020, the state of Wyoming and its localities spent the most. Vermont spent the least, with an appropriation of $3,387. The median per FTEE appropriation (with 50% of states and their localities spending more and 50% spending less) was $8,079.
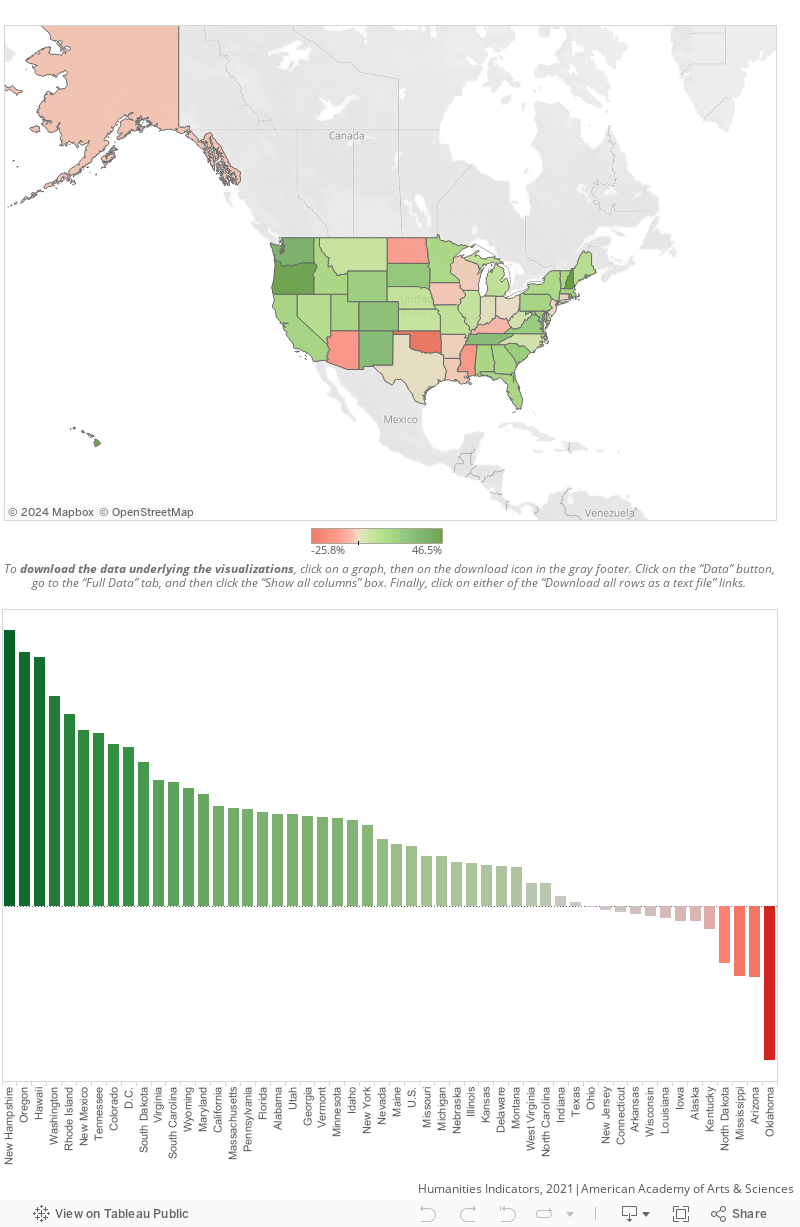
- A majority of states (including the District of Columbia) and their localities appropriated more per FTEE in fiscal year 2020 than five years earlier (Indicator IV-07c). Twelve states saw increases of 20% or more, with New Hampshire, Oregon, and Hawaii increasing their appropriations the most (over 40% in each case). The median increase among states where the appropriation grew over the five years was 15%. Among the 12 states whose appropriations per FTEE declined, Oklahoma experienced the most pronounced drop, 26%. The median decrease was 2.5%. (In comparing states with respect to change in appropriation over time, the size of each state’s baseline appropriation must be taken into account. For states whose initial appropriation level was relatively low, even a modest absolute change can represent a substantial percentage change.)
* Includes appropriations made by all 50 states and their localities. The District of Columbia is excluded from this figure, but information for this jurisdiction is provided in Figures IV-07b and c. See ‚ÄúAbout the Data‚ÄĚ for details on what is encompassed by ‚Äúpublic higher education appropriations.‚ÄĚ
** Inflation adjustment performed by data collector using the Higher Education Cost Adjustment (HECA). For more on HECA, see .
Source: State Higher Education Executive Officers Association, State Higher Education Finance Project. Data downloaded 6/23/2021 from . Data presented by the —«…ę”įŅ‚app‚Äô Indicators (www.humanitiesindicators.org).
For the purposes of these indicators, ‚Äúpublic higher education appropriations‚ÄĚ are:
‚ÄúState and local support available for public higher education operating expenses, defined to include state public financial aid and exclude spending for research, agricultural, and medical education, as well as support for independent institutions or students attending them.‚ÄĚ (State Higher Education Executive Officers Association, State Higher Education Finance, ‚ÄúData Elements, Last Updated April 21, 2020,‚ÄĚ , accessed 6/23/2021). Also excluded are appropriations for agricultural extension and hospitals.
Appropriations include tax appropriations, American Recovery and Reinvestment Act funds, nontax support, and endowment income. See for details.
‚ÄúFull-time equivalent enrollment‚ÄĚ (FTEE) converts student credit hours to full-time academic year students. It excludes ‚Äúmost non-credit or non-degree program enrollments but includes coursework in a vocational or technical program which results in some formal recognition.‚ÄĚ For the purposes of the indicators presented here, FTEE excludes medical students (; accessed 6/23/2021).
IV-07b: Public Higher Education Appropriations per Full-Time Equivalent Enrollment, by State, Fiscal Year 2020
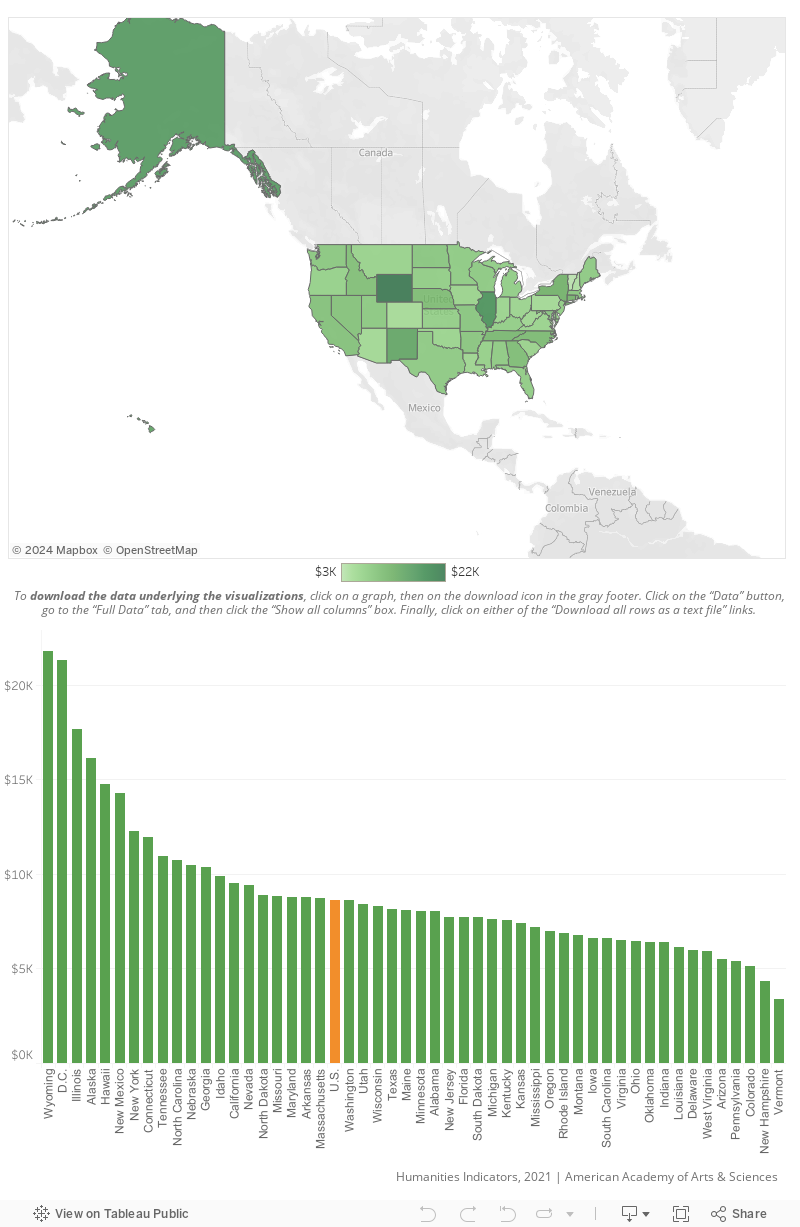
* To help ensure comparability among states, the data collector adjusted each state‚Äôs appropriations by the Cost of Living Index (COLI) and Enrollment Mix Index (EMI). The District of Columbia‚Äôs appropriation was not adjusted by COLI or EMI. See ‚ÄúAbout the Data‚ÄĚ for more on COLI and EMI, as well as for details on what is encompassed by ‚Äúpublic higher education appropriations.‚ÄĚ
Source: State Higher Education Executive Officers Association, State Higher Education Finance Project. Data downloaded 6/23/2021 from . Data presented by the —«…ę”įŅ‚app‚Äô Indicators ().
For the purposes of these indicators, ‚Äúpublic higher education appropriations‚ÄĚ are:
‚ÄúState and local support available for public higher education operating expenses, defined to include state public financial aid and exclude spending for research, agricultural, and medical education, as well as support for independent institutions or students attending them.‚ÄĚ (State Higher Education Executive Officers Association, State Higher Education Finance, ‚ÄúData Elements, Last Updated May 15, 2021,‚ÄĚ , accessed 6/23/2021). Also excluded are appropriations for agricultural extension and hospitals.
Appropriations include tax appropriations, American Recovery and Reinvestment Act funds, nontax support, and endowment income. See for details.
‚ÄúFull-time equivalent enrollment‚ÄĚ (FTEE) converts student credit hours to full-time academic year students. It excludes ‚Äúmost non-credit or non-degree program enrollments but includes coursework in a vocational or technical program which results in some formal recognition.‚ÄĚ (; accessed 6/23/2021). For the purposes of the measures presented here, FTEE excludes medical students.
The explanatory material below is provided by the data collector, the State Higher Education Executive Officers Association (SHEEO), on their State Higher Education Finance Project (SHEF) ‚ÄúData Definitions‚ÄĚ page at .
Cost of Living Index (COLI)
“The cost of living varies greatly across the 50 states, from 82.7% of the U.S. average in Mississippi to 1.36 times the U.S. average in New York. While a cost of living adjustment does not solve the problem of differing intrastate costs of living, it offers a way to get a rough estimate of these differences by adjusting for interstate unit cost data. Financial metrics in the SHEF report are adjusted down in states with a high cost of living and up in states with a low cost of living. This allows for more accurate comparisons on a state’s contribution to public higher education.
State level comparisons in SHEF are adjusted by the state level Cost of Living Index (COLI), calculated annually by the Council for Community and Economic Research (C2ER). This index is based on county-level data collected by the Council for Community and Economic Research. A state index is calculated based on the weighted average of all the counties in each state. COLI is referenced in the Census Bureau‚Äôs Statistical Abstract of the U.S., and has also been used by the U.S. Bureau of Labor Statistics and the President‚Äôs Council of Economic Advisors, among others.‚ÄĚ
Enrollment Mix Index
“Enrollment mix differences pose a challenge for interstate financial comparisons. Each level of higher education, from the first years of undergraduate work through doctoral studies, is progressively more expensive. A state or institution with a large proportion of enrollment in graduate programs will generally have a higher cost per FTE than a state or institution with a larger proportion of enrollment in undergraduate and two-year degree programs.
SHEEO developed an adjustment for interstate enrollment mix differences based on the proportion of enrollment in each state compared to the national proportions of enrollment by Carnegie Classification. Financial metrics in the SHEF report are adjusted down in states with a more expensive enrollment mix and up in states with a less expensive enrollment mix. This allows for more accurate comparisons on a state’s contribution to public higher education.
To calculate EMI, Integrated Postsecondary Education Data System (IPEDS) data are used to develop a national average cost per fall FTE for each of the Carnegie Classifications of institutions. The most recent calculation used financial information from fiscal year 2017 and fall 2016 FTE enrollment data.
The proportion of each state‚Äôs FTE in each Carnegie Classification is multiplied by the national average cost per FTE for that classification. For each state, the products for each classification are summed, which yields the state‚Äôs enrollment mix unit cost for the year. The ratio of enrollment mix unit cost to aggregated national unit cost constitutes each state‚Äôs enrollment mix ‚Äėindex.‚Äô
SHEEO updates the EMI in odd years of the SHEF report and applies the latest EMI to all prior-year data. Regional comparisons include an adjusted version of EMI, weighted by the proportion of FTE enrollment in each state. EMI is not calculated for Washington, D.C.
The data is updated yearly, includes Alaska and Hawaii, and has publicly available methods. The state-level index is not available for Washington, D.C.‚ÄĚ
IV-07c: Percentage Change in Public Higher Education Appropriations per Full-Time Equivalent Enrollment, by State, Fiscal Year 2015 to 2020 (Adjusted for Inflation)
* Inflation adjustment performed by data collector using the Higher Education Cost Adjustment (HECA). For more on HECA, see . To help ensure comparability among states, the data collector adjusted each state‚Äôs appropriations by the Cost of Living Index (COLI) and Enrollment Mix Index (EMI). The District of Columbia‚Äôs appropriation was not adjusted by COLI or EMI. See ‚ÄúAbout the Data‚ÄĚ for more on COLI and EMI, as well as for details on what is encompassed by ‚Äúpublic higher education appropriations.‚ÄĚ
Source: State Higher Education Executive Officers Association, State Higher Education Finance Project. Data downloaded 6/23/2021 from . Data presented by the —«…ę”įŅ‚app‚Äô Indicators ().
For the purposes of these indicators, ‚Äúpublic higher education appropriations‚ÄĚ are:
‚ÄúState and local support available for public higher education operating expenses, defined to include state public financial aid and exclude spending for research, agricultural, and medical education, as well as support for independent institutions or students attending them.‚ÄĚ (State Higher Education Executive Officers Association, State Higher Education Finance, ‚ÄúData Elements, Last Updated May 15, 2021,‚ÄĚ , accessed 6/23/2021). Also excluded are appropriations for agricultural extension and hospitals.
Appropriations include tax appropriations, American Recovery and Reinvestment Act funds, nontax support, and endowment income. See for details.
‚ÄúFull-time equivalent enrollment‚ÄĚ (FTEE) converts student credit hours to full-time academic year students. It excludes ‚Äúmost non-credit or non-degree program enrollments but includes coursework in a vocational or technical program which results in some formal recognition.‚ÄĚ (; accessed 6/23/2021). For the purposes of the measures presented here, FTEE excludes medical students.
The explanatory material below is provided by the data collector, the State Higher Education Executive Officers Association (SHEEO), on their State Higher Education Finance Project (SHEF) ‚ÄúData Definitions‚ÄĚ page at .
Cost of Living Index (COLI)
“The cost of living varies greatly across the 50 states, from 82.7% of the U.S. average in Mississippi to 1.36 times the U.S. average in New York. While a cost of living adjustment does not solve the problem of differing intrastate costs of living, it offers a way to get a rough estimate of these differences by adjusting for interstate unit cost data. Financial metrics in the SHEF report are adjusted down in states with a high cost of living and up in states with a low cost of living. This allows for more accurate comparisons on a state’s contribution to public higher education.
State level comparisons in SHEF are adjusted by the state level Cost of Living Index (COLI), calculated annually by the Council for Community and Economic Research (C2ER). This index is based on county-level data collected by the Council for Community and Economic Research. A state index is calculated based on the weighted average of all the counties in each state. COLI is referenced in the Census Bureau‚Äôs Statistical Abstract of the U.S., and has also been used by the U.S. Bureau of Labor Statistics and the President‚Äôs Council of Economic Advisors, among others.‚ÄĚ
Enrollment Mix Index
“Enrollment mix differences pose a challenge for interstate financial comparisons. Each level of higher education, from the first years of undergraduate work through doctoral studies, is progressively more expensive. A state or institution with a large proportion of enrollment in graduate programs will generally have a higher cost per FTE than a state or institution with a larger proportion of enrollment in undergraduate and two-year degree programs.
SHEEO developed an adjustment for interstate enrollment mix differences based on the proportion of enrollment in each state compared to the national proportions of enrollment by Carnegie Classification. Financial metrics in the SHEF report are adjusted down in states with a more expensive enrollment mix and up in states with a less expensive enrollment mix. This allows for more accurate comparisons on a state’s contribution to public higher education.
To calculate EMI, Integrated Postsecondary Education Data System (IPEDS) data are used to develop a national average cost per fall FTE for each of the Carnegie Classifications of institutions. The most recent calculation used financial information from fiscal year 2017 and fall 2016 FTE enrollment data.
The proportion of each state‚Äôs FTE in each Carnegie Classification is multiplied by the national average cost per FTE for that classification. For each state, the products for each classification are summed, which yields the state‚Äôs enrollment mix unit cost for the year. The ratio of enrollment mix unit cost to aggregated national unit cost constitutes each state‚Äôs enrollment mix ‚Äėindex.‚Äô
SHEEO updates the EMI in odd years of the SHEF report and applies the latest EMI to all prior-year data. Regional comparisons include an adjusted version of EMI, weighted by the proportion of FTE enrollment in each state. EMI is not calculated for Washington, D.C.
The data is updated yearly, includes Alaska and Hawaii, and has publicly available methods. The state-level index is not available for Washington, D.C.‚ÄĚ
